Getting started
Open the app, start a backtesting session, and understand your first chart in about five minutes.
Open the app
Open the app and sign in with Google — that is how a new account is created, and it takes a couple of clicks. If you had a password account, sign in with the Google account of the same email and it opens, with its plan and data. Nothing to install, and no operating system requirement: the chart loads in any current browser.
Start a session
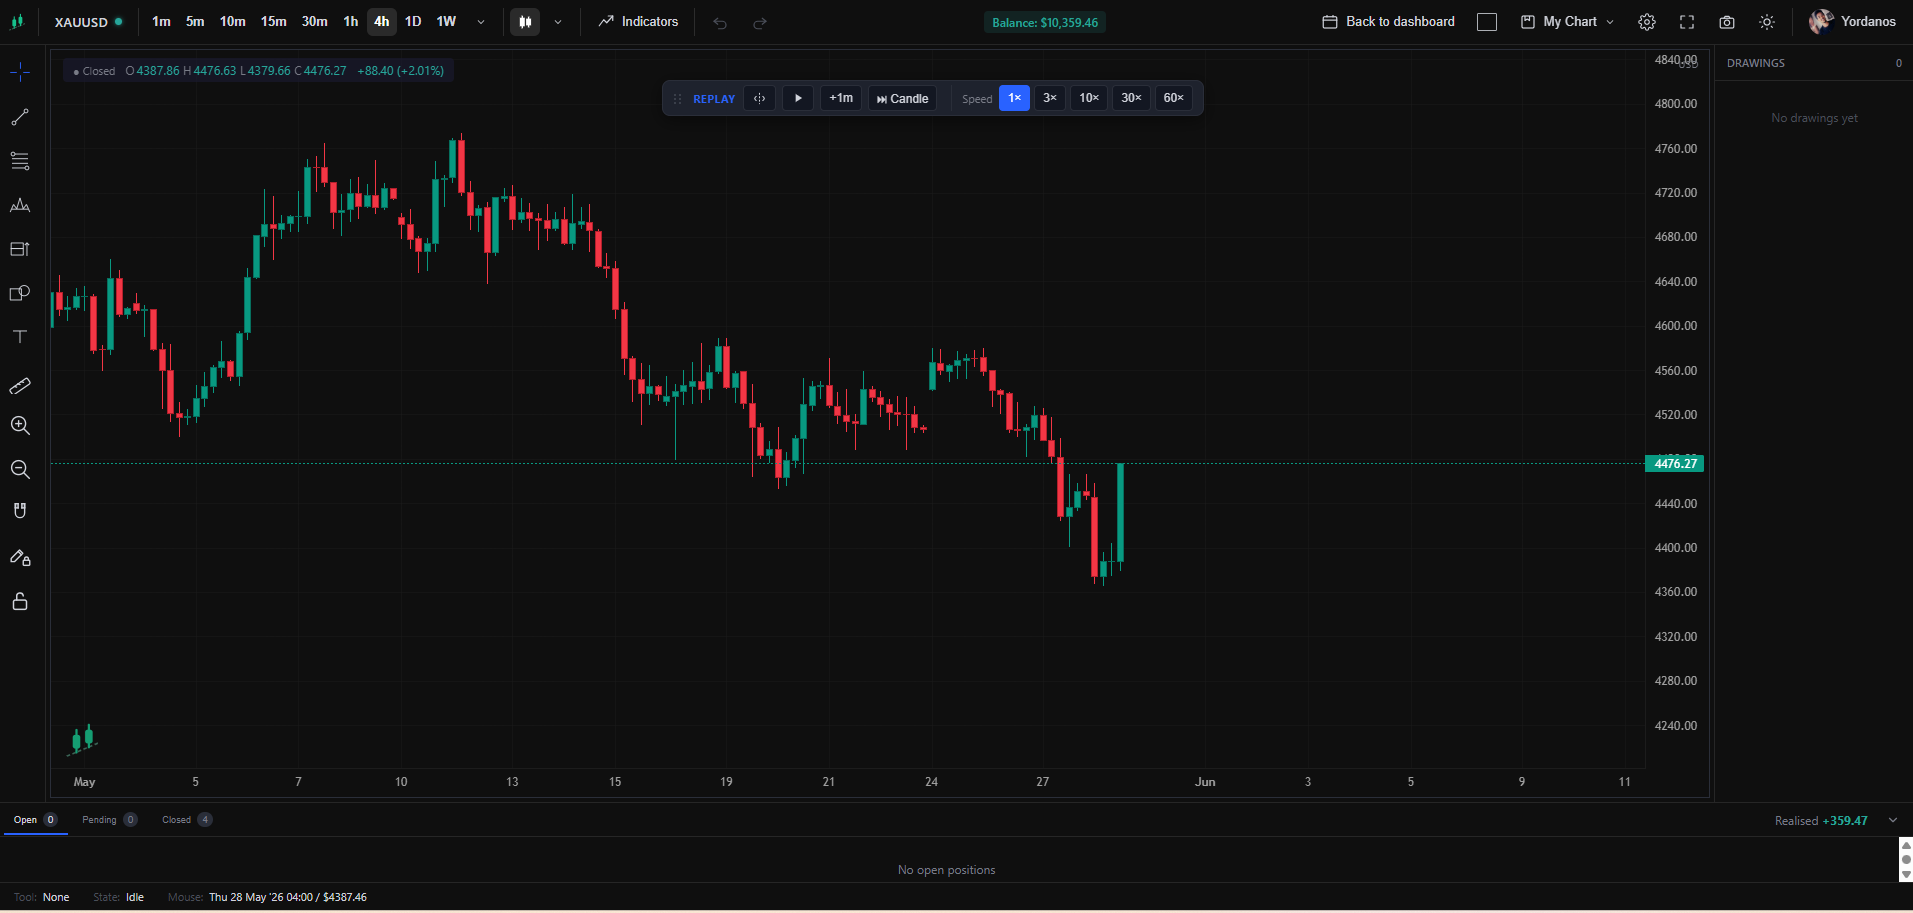
Pick a pair and a date range, set a starting balance, and the app loads that period from our price archive. Minute data is downloaded once and every other timeframe is built from it in your browser, so switching between 1m and 4h is instant.
Replay and trade
Step the chart forward candle by candle and place paper trades as the market moves. There is no lookahead: the chart only ever shows what had happened by the simulated moment you are standing in.
Draw & annotate
Pick a tool from the left panel and click to place anchors. Drawings live in chart-space, so they survive zooming, panning and time-frame changes.
Your work is saved
Sessions, trades, journal entries, layouts and drawings are saved to your account, not just to the browser.
Sign in from another machine, or clear this one, and everything is still there.